Hi, my name is Markus Schanta and this is my personal blog.
In 2019 I founded BlueBalance Capital together with my partners. Prior to that, I was a quantitative researcher at London-based asset management and before that, I was a quantitative strategist at an international investment bank. I hold a Master’s degree in Computer Science from Columbia University in New York, where I also received a Fulbright Scholarship and a Bachelor’s degree from Vienna University of Technology.
On a day-to-day basis, I analyse data to better understand a trade, a larger economic development, a company or an industry. In technical terms, that means a lot of data wrangling or visualising data. My tools of chice are Python, pandas, Jupyter and altair. I have given talks about how I use these tools at various conferences. You find my open-source code on GitHub. This blog is a collection of posts that further explain some of the tools/techniques that I use.
Caveat emptor: I just started this blog in November 2022, so there might only be a limited number of articles here.
A quantitative recap of the 2022 FIFA World Cup
How each team’s probability of reaching a particular stage has evolved over time
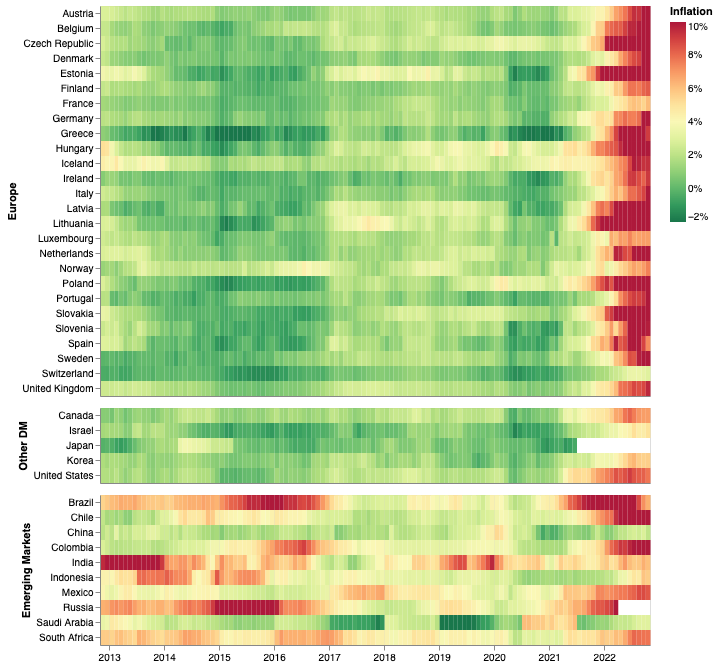
“It’s the inflation, stupid!”
Putting inflation in perspective historically and cross-sectionally by looking at data from the OECD data warehouse.
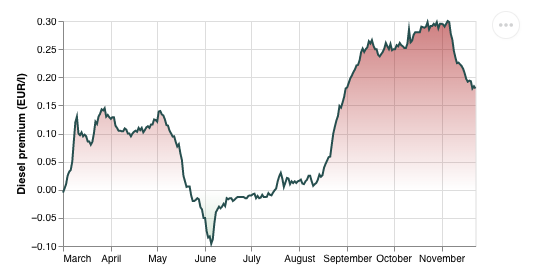
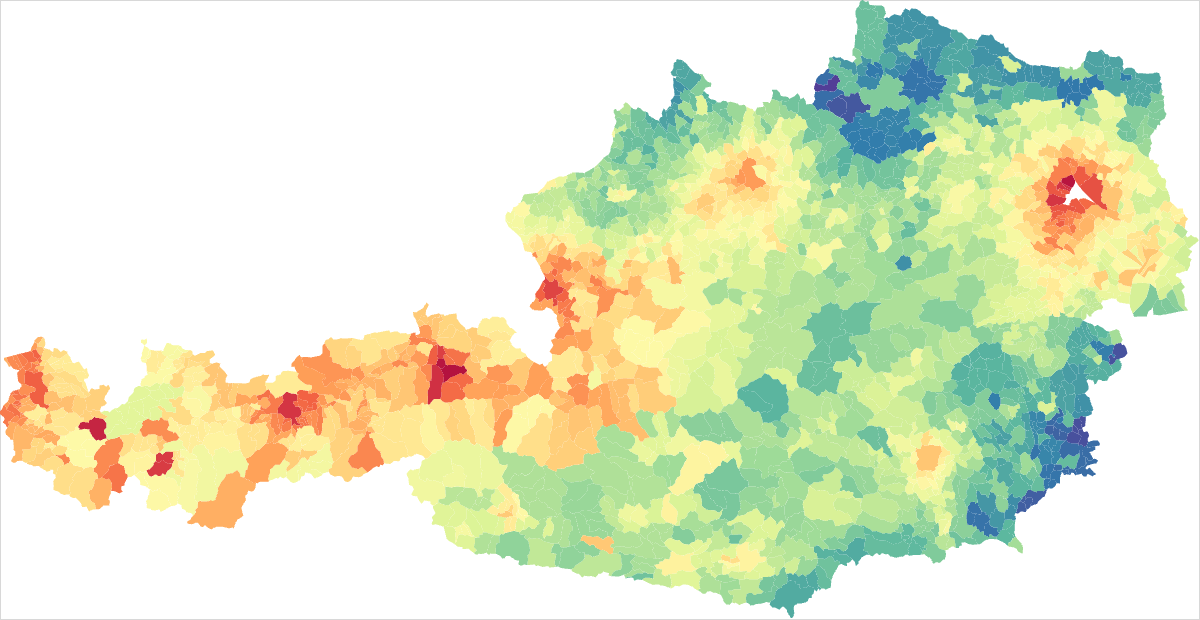
Fuel Prices in Austria
An analysis of fuel prices in Austria across regions, fuel types and over time.
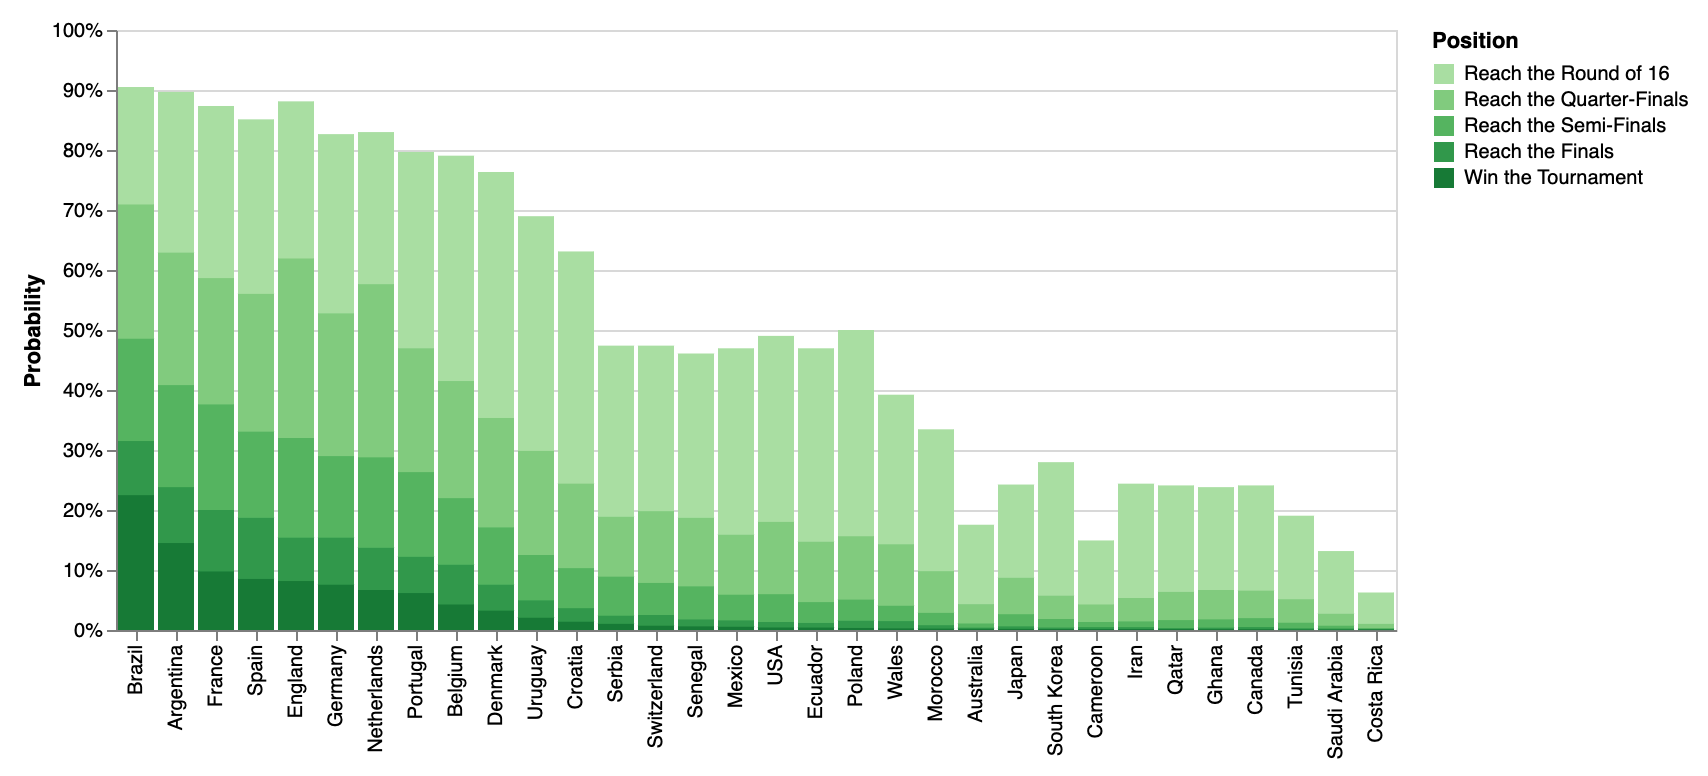
Who Will Win the World Cup? A Quantitative Approach.
2022 FIFA World Cup betting odds and what they tell us about each team’s likelyhood to succeed.